Login
17 Nov
Al Manning explains why analysing the data is key to improving performance.
Al Manning
Job Title
Herd health plans (HHPs) must be carried out on an annual basis for the majority of dairy farms. In the UK, all dairies that are Red Tractor-accredited are required to have an annual health and performance review, as part of the HHP (Red Tractor, 2022).
When making farm-specific recommendations, it is important to have an understanding of the current level of performance and disease on your farms.
Data analysis is, therefore, an essential diagnostic tool when making herd health recommendations, and it is also important for monitoring progress.
Ultimately, if compliance with the herd health plan is poor, data analysis can be used to demonstrate a lack of progress, or even worsening of performance.
This article will review the different sources of data available for vets and advisors, and give tips for making the most out of farm data.
Advisors should be aware of the types of data that may be available on farm. Broadly, this can be split into data held on farm (for example, in a farm diary or on-farm software), or data held remote from the farm (for example, the vet practice, technical services, nutritionist, consultant, milk recording organisation, milk buyer or genetic database).
Data held on farm is usually more accurate; however, it relies on a member of farm staff to record it. At a basic level, all events and health treatments should be recorded in a farm diary; however, analysing paper records can be time consuming. Information recorded in an on-farm software is usually more consistently recorded and accessible. Remote data is usually a very consistent method, as data are recorded systematically. However, remote data sources only record what is relevant to the company collecting the information; for example, milk recording organisations usually record no information on youngstock, which can limit fertility analysis.
Before analysing data, it is important to understand what is being recorded. Table 1 gives examples of the events that may be useful for different areas of analysis. Broadly speaking, the more information a farmer is recording, the more useful it can be for herd health planning.
| Table 1. Useful events that can be used for analysis of farm performance. These events are adapted from recommendations from the International Committee of Animal Recording (ICAR, 2024) | |
|---|---|
| Area | Events |
| Fertility | Calvings; heats; services; pregnancy results; health events (retained membranes, metritis, endometritis, abortion, stillbirth); treatments; synchronisation programmes; barren selection (that is, do not breed). |
| Udder health | Clinical mastitis cases, cows and quarters affected; when in lactation they are occurring (proximity to the dry period); severity (including toxic cases); deaths and culling; somatic cell count testing (ideally on a monthly basis); California Mastitis Test results; automated mastitis detection (electrical conductivity, colour, temperature). |
| Lameness | Lame events with limb, lesion and severity; treatments; foot trimming events with limb; lesions and severity; mobility scoring; footbathing chemical, concentration, and frequency. |
| Nutrition and production | Milk recording (yield, fat, protein, lactose, urea – ideally on a monthly basis); metabolic profiling (energy status, protein, minerals, trace elements); metabolic disease (milk fever, hypomagnesiaemia, ketosis, ruminal acidosis, displaced abomasa); ration formulation (adult cattle and calves); colostrum management. |
| Johne’s disease | Milk or blood ELISA test results; faecal PCR and culture; dam or sibling results; historic results and culling. |
| Genetics | Parent average genetic estimation; genomic test results; recessive traits. |
| Culling | Reasons for culling; differentiation of culls, sales and deaths; voluntary versus involuntary culls. |
In farms where natural mating is used, service dates might not be recorded, which can limit fertility analysis.
No sense exists in analysing data without a clear objective – advisors should have a working hypothesis; that is, what are you trying to show? This may be influenced by farmer objectives and motivation.
Objectives may be short-term or long-term, they may be aspirational, or may be a requirement of their contracts. Aspirational goals are aiming towards constant improvement; farmers are simply trying to get better. For contract-related goals, farmers are often working towards a defined target, and this may be linked to payment incentives or penalties.
The more that farmers engage with their targets, the more they are likely to achieve them – longer term, sustained engagement is important to maintain progress (Rose et al, 2018).
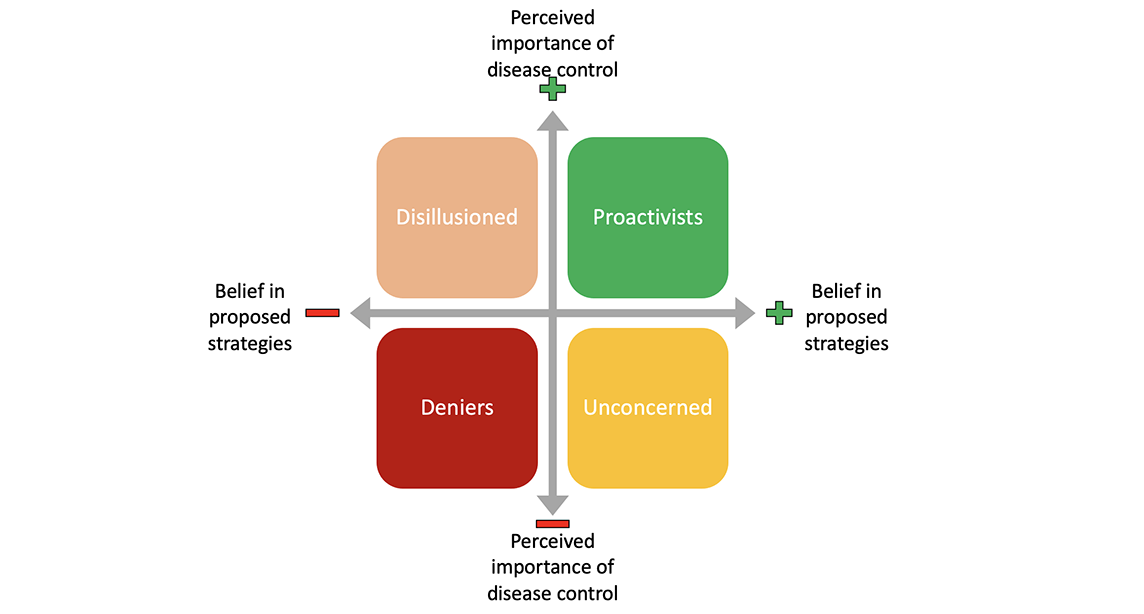
One proposed model for farmer motivation is summarised in Figure 1, adapted from Ritter et al (2016).

Figure 1. A proposed model for classifying farmer motivation, adapted from Ritter et al (2016).
This model splits farmers into four groups based on their perception of the importance of a problem, and their belief in their advisor(s) to solve the problem. In the study by Ritter et al, the model is used to demonstrate approaches to Johne’s disease control, but it can be applied to other areas of herd health.
It should be stressed that this is just one model of thinking about farmer motivation. Whatever approach you use as an advisor, understanding farmer motivation is key to improving herd health.
When writing HHPs, it is common to include targets. To set effective targets, it is essential to have an underlying understanding of the farming system and the associated language.
All-year round calving herds use different fertility language to block calvers (see Table 2), and failure to adopt the correct terminology can reduce the impact of your advice. Language used around mastitis can also be unclear – it is useful to clearly define the difference between a clinical mastitis case (that is, clots or blood present in the milk) and subclinical mastitis (that is, elevated somatic cell count without visible changes).
| Table 2. Commonly used fertility language on all-year round and seasonal calving dairy herds | |
|---|---|
| Farming system | Important fertility language |
| All-year round calving | ● Voluntary wait period ● Eligible cows ● First service submission rate ● Conception rate ● 21-day pregnancy rate ● Calving to conception interval ● Calving interval |
| Seasonal calving | ● Planned start of mating (PSM) ● Planned start of calving (PSC) ● Planned end of mating (PEM) ● Animals in the herd at PSM ● 3-week, 6-week and 12-week submission rate ● 3-week, 6-week and 12-week pregnancy rate |
When setting targets, it is important they are clearly defined, realistic and achievable. Vets and advisors should be familiar with any contractual targets that may exist for farmers on aligned contracts. The way that contractual targets are set can make a difference to farmer motivation: one study found that farmers were more motivated by penalties for high cell count milk than an equivalent bonus for low cell count milk (Valeeva et al, 2007).
Key performance indicators (KPIs) are single statistics that can be used to measure performance in one area. Several publications use KPIs to monitor performance of the UK dairy industry over time, and readers are directed towards these useful reports (Hanks et al, 2024; Kingshay, 2023; Leach et al, 2024).
Benchmarking farm performance against published figures can be a useful tool to stimulate farmer discussion and motivate farmers to improve relative to their peers (Sumner et al, 2018). This is particularly useful for the “unconcerned” group of farmers in the study by Ritter et al (2016). Farmers can be benchmarked against other farms in the country, within the milk buyer pool or within your group of clients.
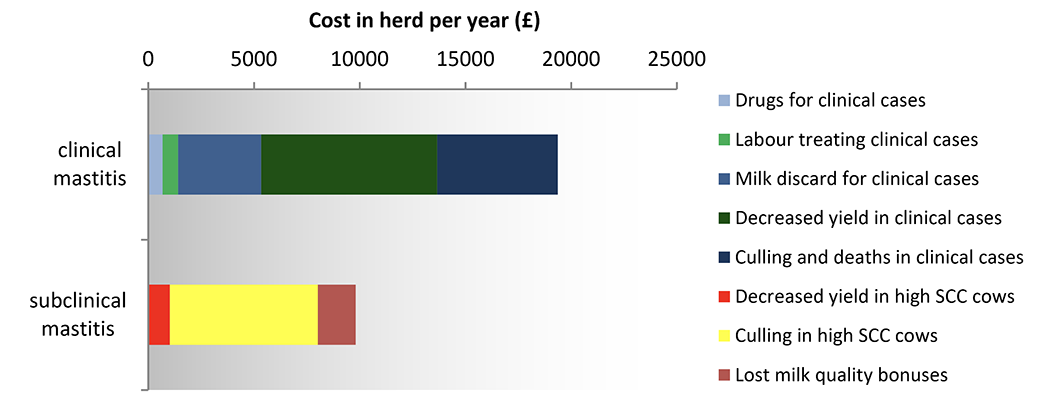
Cost calculators can be useful for farmers more motivated by economics. Figure 2 shows an example of a mastitis cost calculator that is available to vets and advisors through QuarterPRO (Quality Milk Management Services, 2021).

Figure 2. An example of the costs of mastitis in a 200-cow herd. Cost calculator available for free at tinyurl.com/bdeevxkt
On top of the visible costs (drugs, labour, milk discard), it is important to highlight “hidden” costs that farmers may be less aware of. In this example the biggest costs of mastitis are hidden – reduced milk production and increased risk of culling.
Other farmers may be motivated by things that are less easily measured; for example, better welfare. Vets and advisors can monitor “proxies”, figures used to represent a less easily measured outcome, often a subjective or objective measure of animal behaviour; for example, Cow Comfort Index, defined as the proportion of cows in contact with a cubicle that are standing, is a reasonable proxy for cubicle suitability (Cook et al, 2005).
The proportion of cows exiting the herd in the first 100 days in milk is a reasonable proxy for “unplanned exits”; that is, those caused by early lactation disease or injury (Pinedo et al, 2010).
The number of data capture software and data formats is increasing in all industries. To keep up with farmer demand, vets and advisors need to be familiar with data analysis software.
Basic calculations can be carried out in spreadsheets, but more advanced assessment of farm performance requires bespoke software. This software can help identify the limitations of farmer data. Most software will produce a list of the kind of event data highlighted in Table 1, and this is a useful place to start. Where farms are not recording everything they could be, more regular herd health advice can help to show value and encourage better record keeping.
Farmers should be shown the value of better recording and given clear advice about what, and how, to record better.

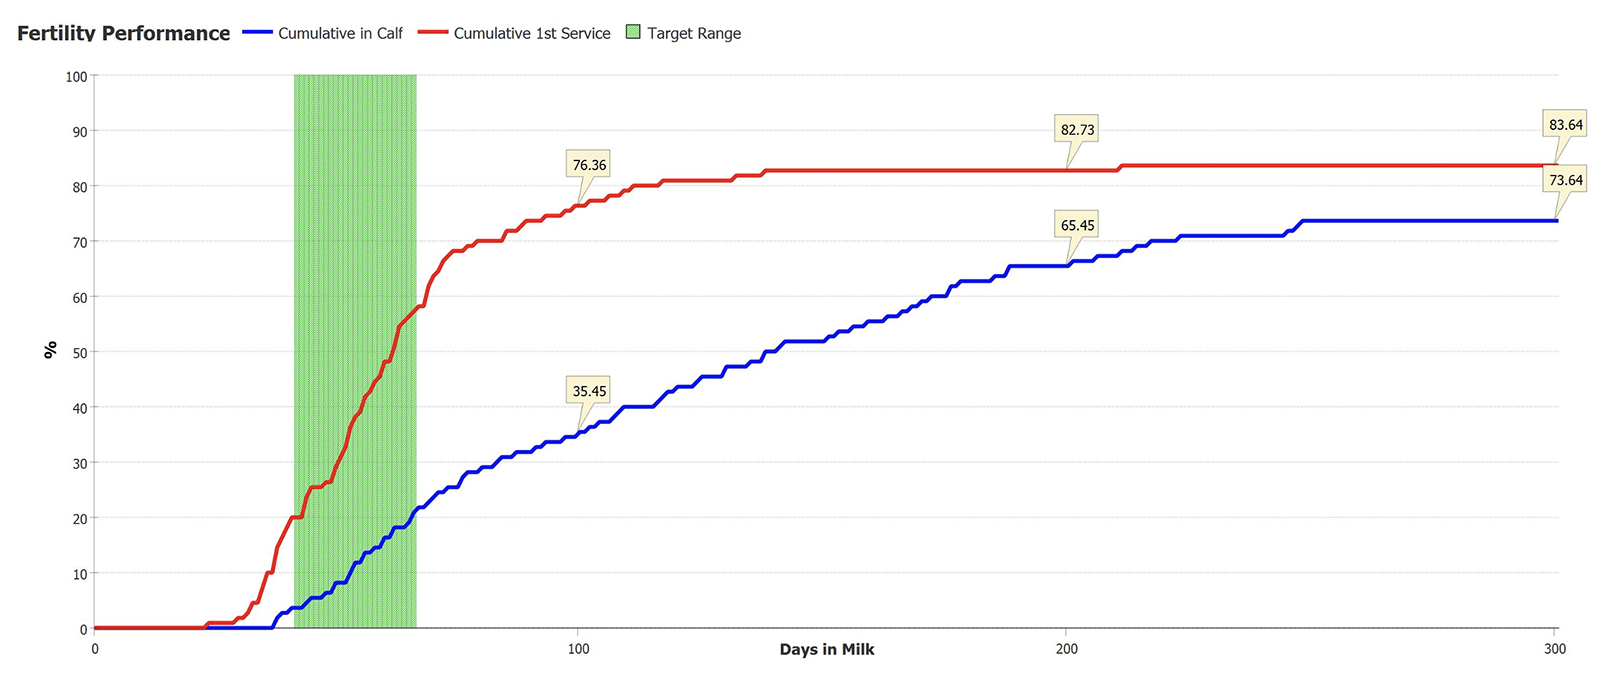
Figure 3. Survival analysis of time to first service and first conception for lactating cows within 300 days.
Most dairy farmers are interested in fertility performance. Figure 3 shows a survival analysis of time to first service and first conception, as an example of one of the tools that can be used to generate discussion on farm.
In the UK, several structured approaches to managing dairy cow health exist. Examples include the Mastitis Control Plan, QuarterPRO (Agriculture and Horticulture Development Board), Healthy Feet Programme, National Johne’s Management Plan, Cattle Health and Certification Standards-approved health schemes, BVDFree (England) and Gwaredu BVD (Wales). All of these programmes require a level of diagnostic testing and data analysis to identify patterns of disease leading to farm-specific advice.
These structured approaches are ideal for progressive farmers, but can also be useful for those disillusioned with previous advice or unconcerned about their current health status.
Use of technology in farming is accelerating, which means more data are likely to be available to farmers, vets and advisors. Several new and emerging technologies will soon be generating data for use in herd health. Some examples include:
Registered Veterinary Nurse (Part Time)
£30,000 per year
Warren House Veterinary Group
Glenrothes, Fife
Registered Veterinary Nurse (Part Time)
£30,000 per year
Warren House Veterinary Group
Glenrothes, Fife
Registered Veterinary Nurse (Part Time)
£30,000 per year
Warren House Veterinary Group
Glenrothes, Fife